
The festive season presents a significant opportunity for eCommerce brands. As demand increases for a variety of goods, sales will rise, marketing campaigns will be supported, and customers will shop like never before. Properly managing supply-chain factors allows eCommerce brands to capitalize on holiday purchase trends. However, the real competitive advantage derives from analyzing the data generated during this year’s festive period to help with predictive analytics in demand planning and prepare for next year’s purchasing trends.
The brands that leverage their festive data effectively can forecast demand, optimize inventory, plan marketing campaigns, and maximize profitability. This is where MapleMonk’s demand planning tool becomes indispensable.
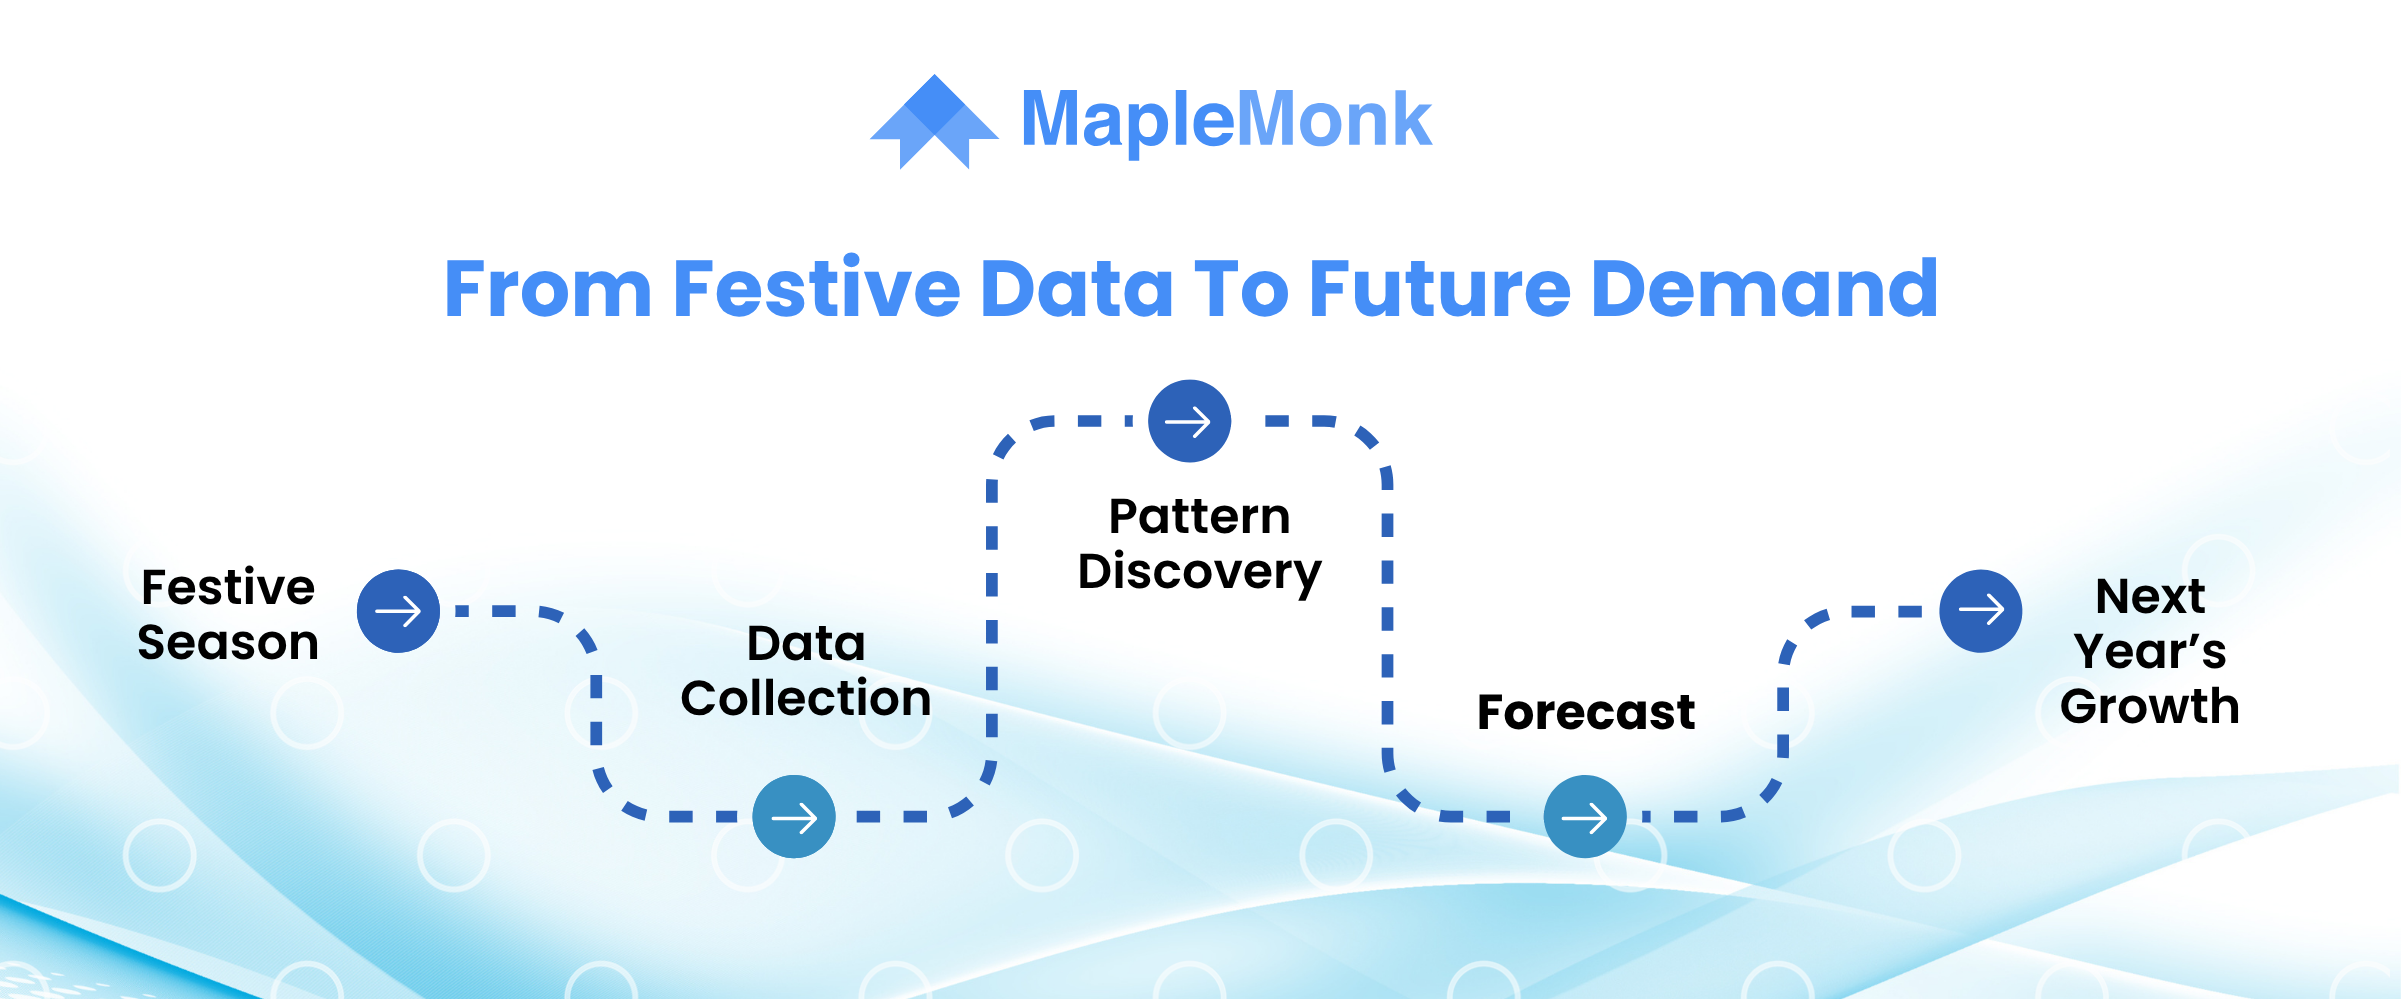
In this blog, we’ll dive deep into how to turn this year’s festive data into actionable predictions for next year, backed by data and actionable strategies.
It is essential to have clarity on the data before looking at predictive analytics in demand planning. A complete data audit will allow you to assess key performance indicators (KPIs), as well as the factors that influenced sales.
Data Insight: As Statista reports, retail eCommerce sales in the United States have improved every year during the holidays and festive season. This indicates the importance of the holiday season continues to grow for retailers.
Action Step: Use MapleMonk’s best Demand Planning Software to compile and review all of this data, to give context to your performance during the festive season.
Identifying patterns and outliers in sales data allows the analyst to glean insightful information about consumer behavior and market trends.
Data Insight: Research shows brands that recognize their peak sales days with data can also reduce their risk of stock-outs by up to 25% during peak sales periods.
Action Step: Use MapleMonk’s analytics to understand sales trends and seasonal patterns that can inform your future strategies.
Not all customers behave the same way. Segmenting your customer base allows for more targeted marketing and inventory planning.
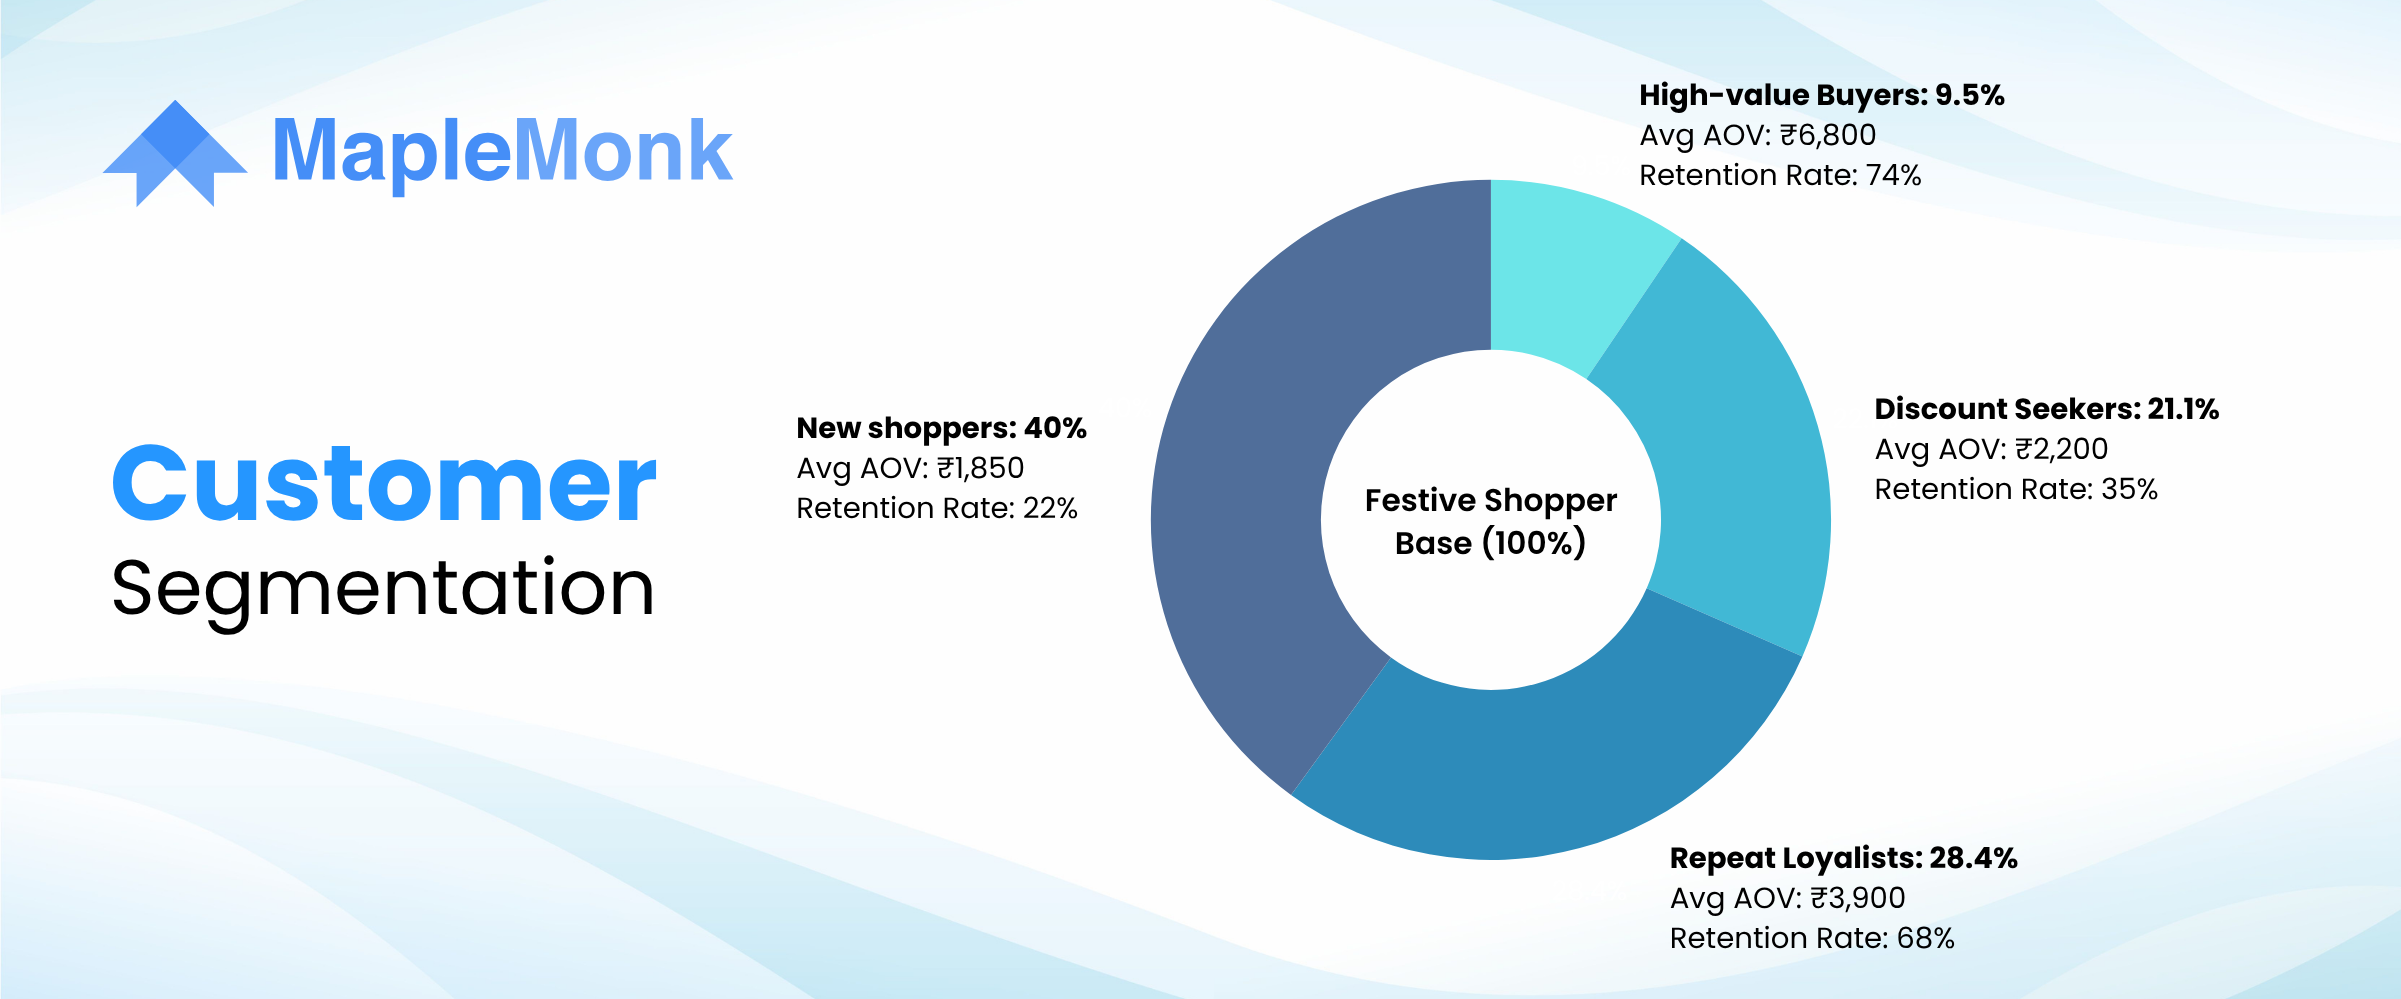
Data Insight: McKinsey is reporting that repeat buyers account for much of what is sold for the holidays, so having strategies in place to retain customers will be important.
Action Step: MapleMonk will be helpful for you to categorize your customers and align your strategies accordingly.
Identifying which products are most likely purchased together can support inventory management and cross-selling approaches.
Data Insights: Combining data analysis with your Cross Selling strategies could increase the average order value by 10-30%, particularly during festive season.
Action Step: Consider use of MapleMonk’s inventory forecasting software for product affinity analysis. Using this analysis you will discover insights that will influence sales and inventory optimization.
Internal data provides valuable insights, but external factors can also influence consumer behaviour and market trends.
Data Insight: Google Trends showed a 35% YoY increase in searches for “eco-friendly gifts” in 2024, a signal that many brands used to expand sustainable collections early.
Action Step: Feed these trend signals into MapleMonk’s integrated dashboard. It overlays internal and external data to fine-tune forecasts and predict demand volatility for the coming year.
Insights mean nothing unless they influence action. Predictive analytics for eCommerce should flow into every operational decision, from purchasing to marketing.
Data Insight: Forrester found that brands integrating predictive models into logistics achieved 25% faster inventory turnover and 15% cost savings on warehousing.
Action Step: Use MapleMonk’s system to integrate your operations with forecasting insights so you can execute your strategies and plans seamlessly.
Even experienced planners tend to repeat predictable common mistakes when making forecasts for next year based on this year’s festive data. The issue is rarely attributed to a lack of data. Rather, it is how this data is analyzed, connected, and utilized. Below are some of the most common forecasting mistakes brands make, and how MapleMonk’s AI-powered Demand Planning tool helps eliminate them.
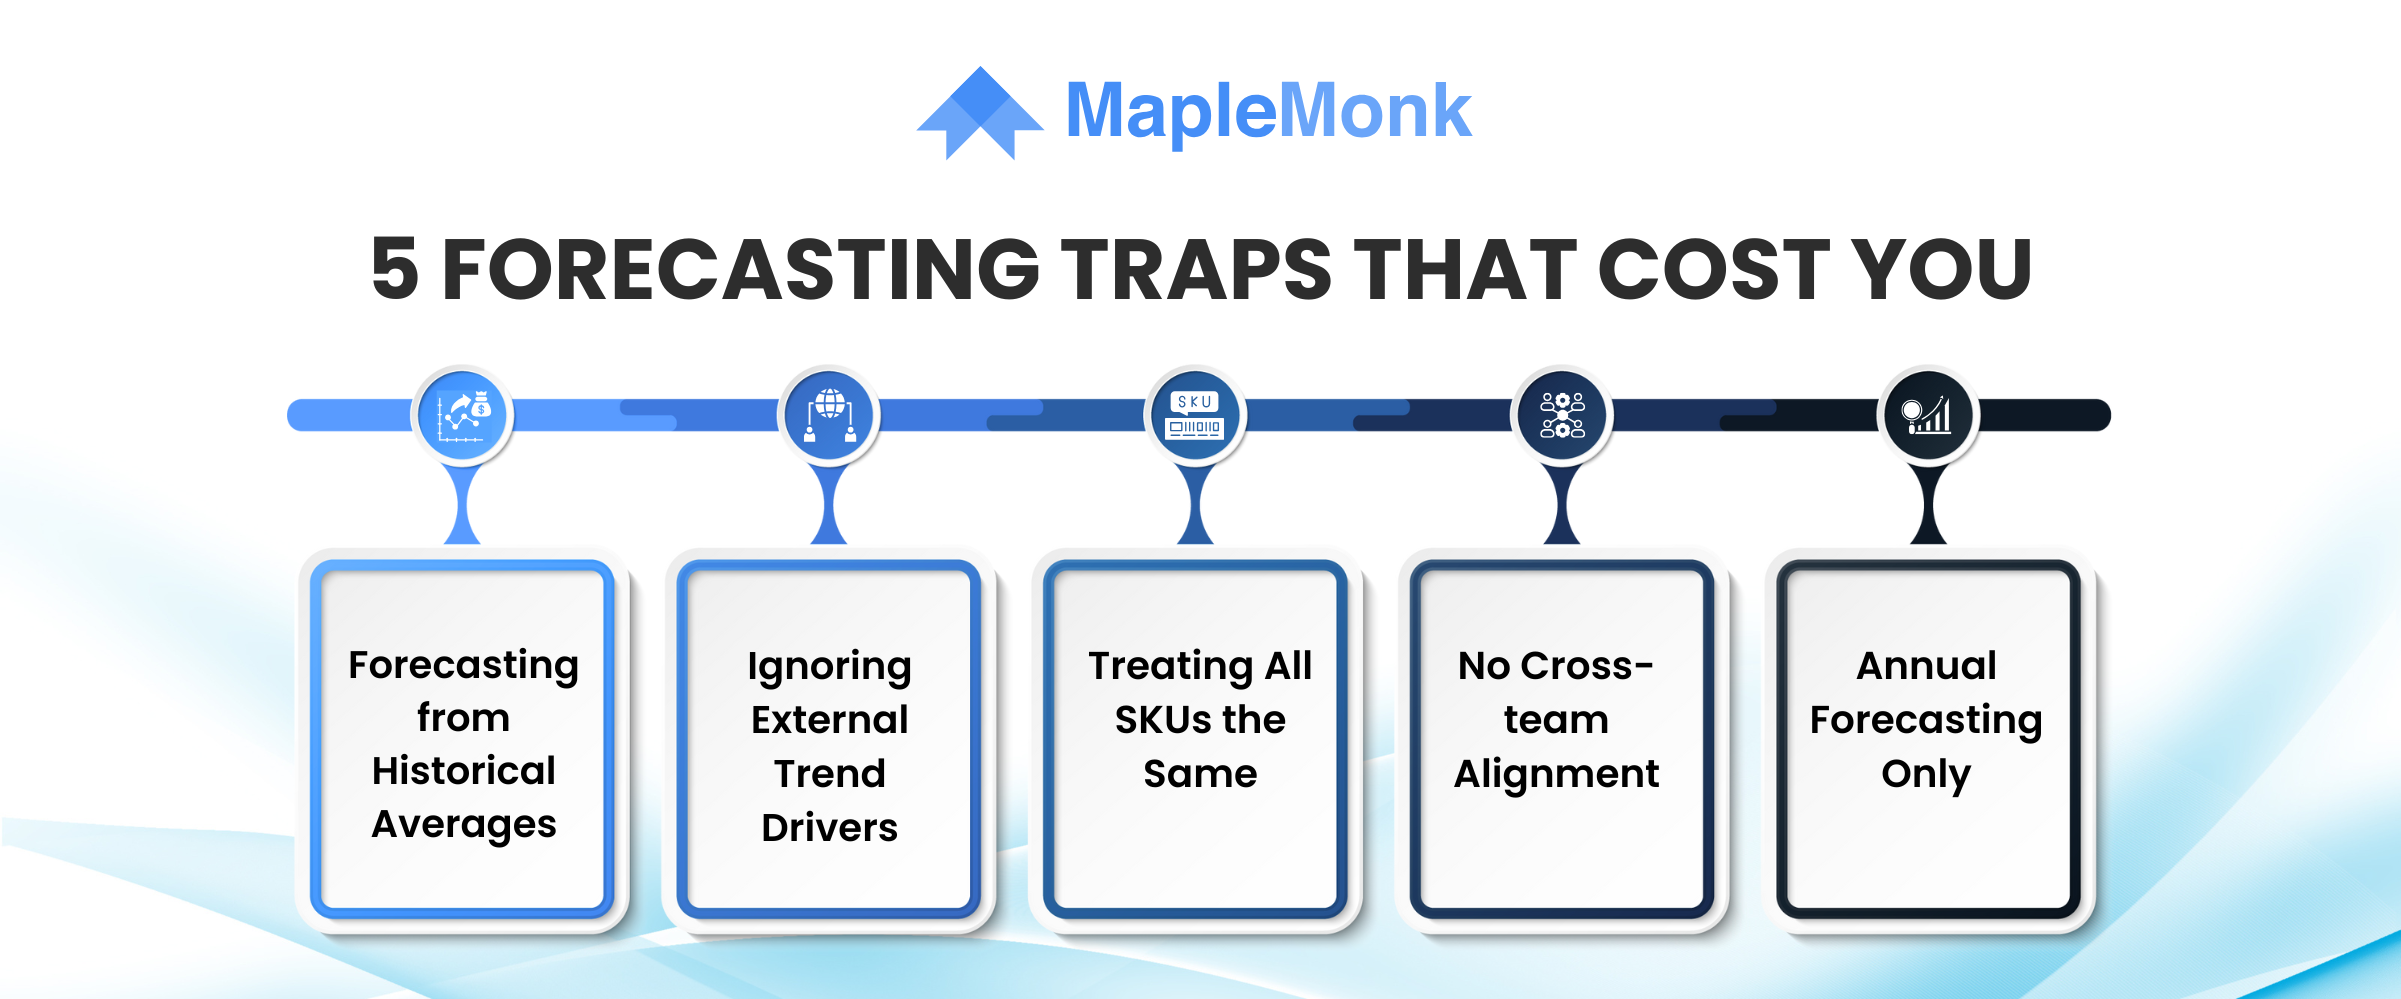 Relying on Historical Averages Instead of Dynamic Data
Many teams still rely on static year-over-year comparators or simple moving averages to make judgments about future demand planning methods. Such methods simply do not take into consideration the volatility of consumer behavior, the evolution of sales channels, and the evolution of seasonal cycles that exist today.
What Happens:
Static models tend to under-forecast fast-moving SKUs, and over-forecast slow-moving SKUs, creating imbalances and lost sales.
How MapleMonk Steps in:
MapleMonk’s forecasting engine analyzes multi-year holiday data, and applies recency, seasonality, and external consumer conditions like keyword trending, competitive pricing, and marketplace activity to dynamically weight the analysis. The results account for adaptive forecasting that evolves in real time to changing demand.
If you only listen to the internal transaction data, you only have half the story. It tells you what sold, but it doesn’t tell you why it sold.
What Happens:
When consumer sentiment, competitor campaigns, or macroeconomic indicators change, forecasts based on the sales data quickly lose relevance. For example, if athleisure saw demand grow by 12% during one festive period, it could be due to influencer collaborations rather than a direct interest in athleisure.
How MapleMonk Steps in:
MapleMonk integrates external data signals, including search trends, ad impressions, and social media posts, against historical sales data. By integrating those signals against sales data, planners understand what actually contributes to conversion so demand forecasts on your demand planning software can be created based on leading indicators.
Another widespread mistake is assuming uniform behaviour across SKUs and customer cohorts. High-volume products, long-tail SKUs, and niche categories each respond differently to pricing, timing, and promotion strategies.
What Happens:
Inventory budgets are misallocated, resulting in overstocking low-margin products and understocking high-performing ones. Brands lose clarity on price elasticity and true category profitability.
How MapleMonk Steps in:
MapleMonk enables SKU-level and cohort-based forecasting, segmenting demand by product type, purchase frequency, and customer value. The system highlights “hero products” that drive margin growth and “halo products” that influence upsells or cross-category baskets, ensuring your inventory forecasting software aligns properly with profitability goals.
Even the most accurate forecasts lose their impact if they are not connected with procurement, logistics, and marketing operations. Siloed systems create communication gaps that lead to execution failures.
What Happens:
Procurement teams may delay reorders, marketing may promote unavailable SKUs, and fulfillment struggles to meet unexpected peaks in demand. The result is stock-outs, markdowns, and dissatisfied customers.
How MapleMonk Steps in:
MapleMonk integrates demand forecasts with operational systems, ensuring end-to-end alignment between planning, sourcing, and promotion. This ensures smoother coordination and higher forecast utilization.
Many brands still treat forecasting as a once-a-year activity, typically conducted after the festive season. But demand is dynamic, influenced by new product launches, evolving customer intent, and external disruptions throughout the year.
What Happens:
Static forecasts quickly become outdated, leading to mid-year stock corrections or last-minute promotional markdowns that erode margins.
How MapleMonk Steps in:
MapleMonk transforms forecasting into a continuous process. Its models automatically update as new data flows in, whether from sales, marketing performance, or external signals. This continuous learning loop ensures that forecasts remain accurate and responsive to real-time shifts in consumer demand.
To make predictions truly valuable, brands need more than data collection. They need a closed-loop best demand planning software that learns from every festive season, refines itself continuously, and converts insights into profit-driving actions.
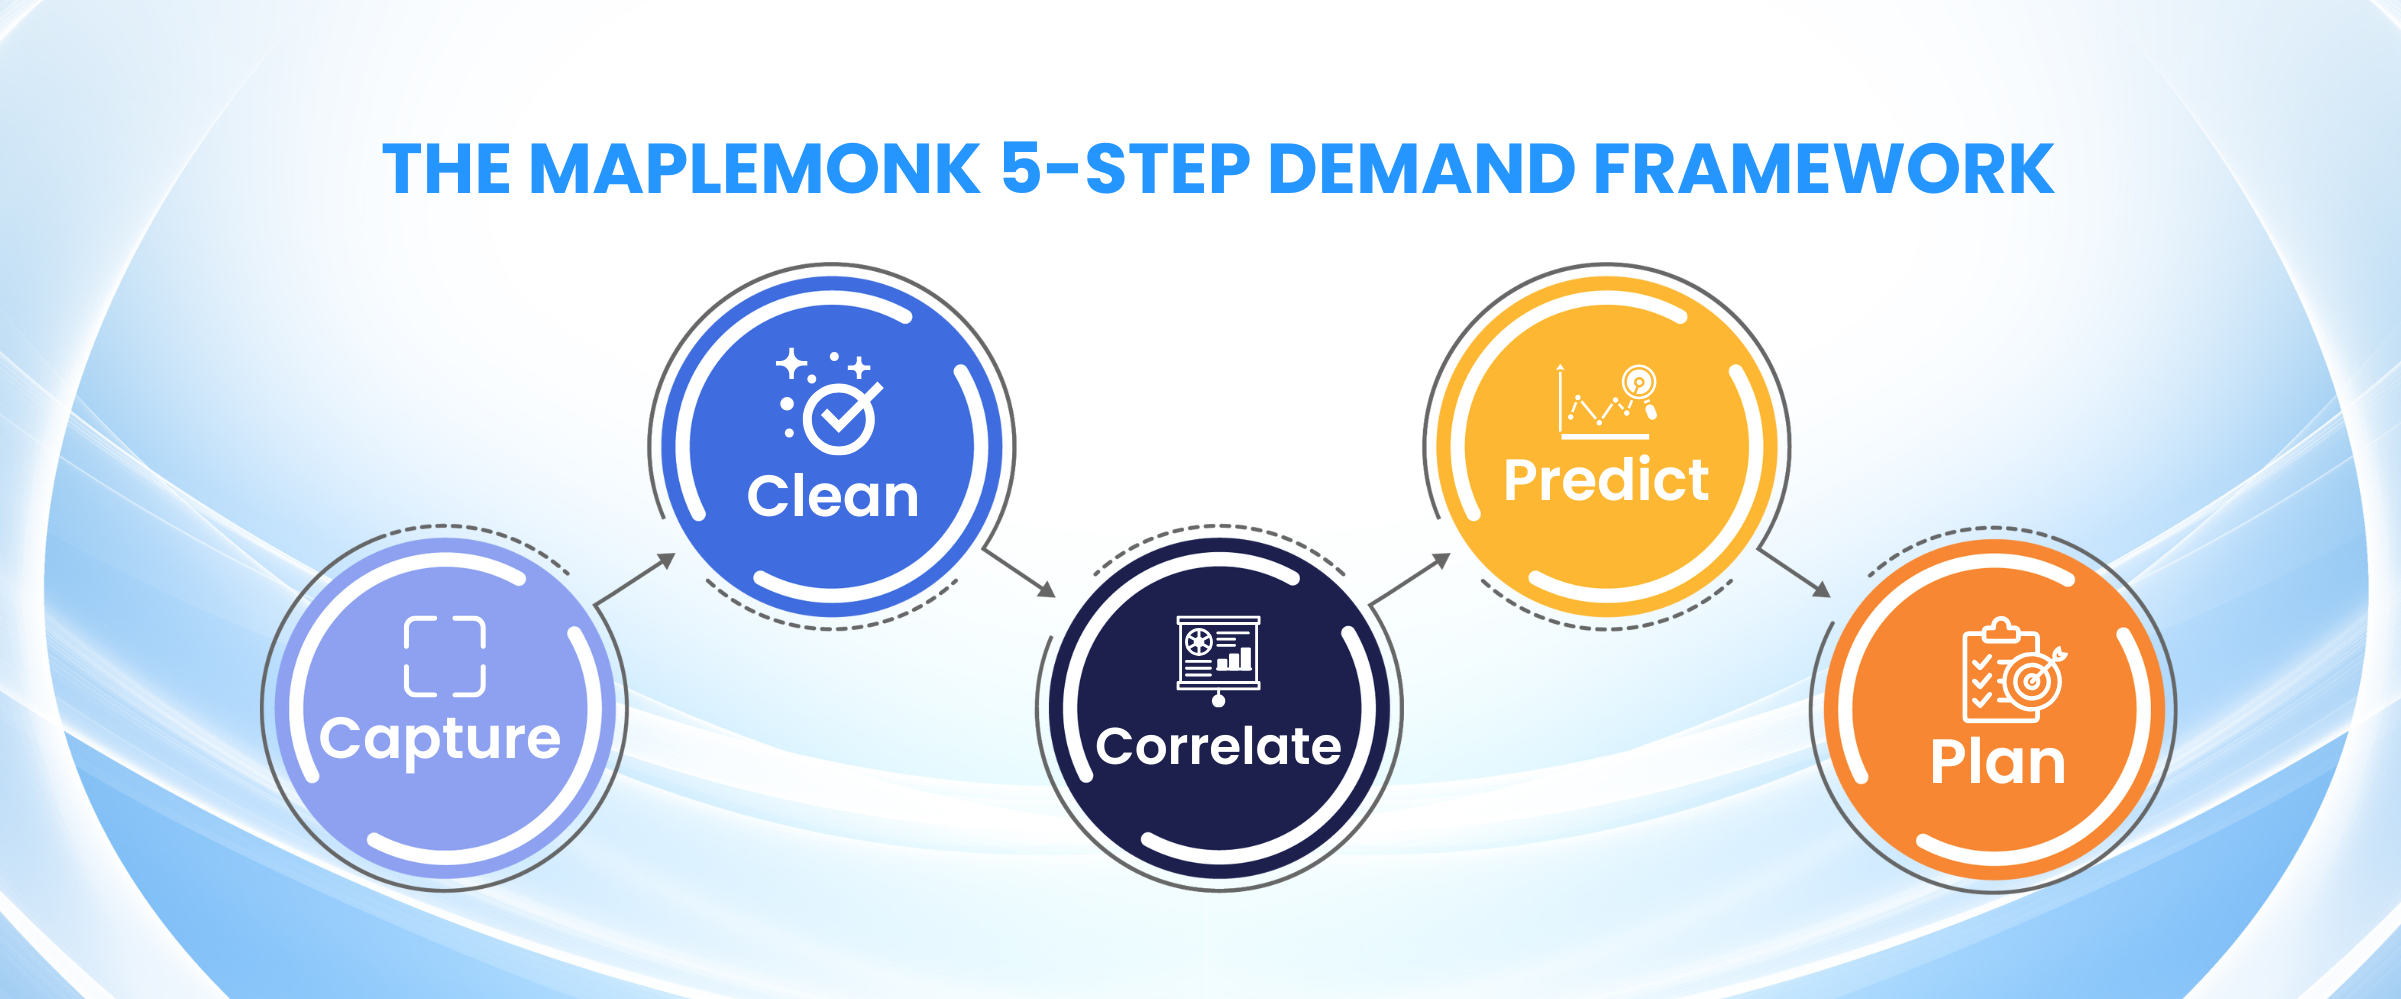
As a result, the self-learning demand ecosystem becomes more accurate, adaptive, and profitable with every festive cycle enabling brands to reduce forecast variance by up to 40%, improve sell-through rates by 25%, and convert predictive analytics for eCommerce directly into measurable business outcomes.
The festive season leaves behind more than just sales reports, it leaves behind predictive analytics in demand planning. Hidden in your transaction data, campaign metrics, and customer behavior are the clues to what will drive demand next year. The brands that decode these clues early are the ones that stay ahead, they launch smarter, stock better, and market sharper.
But prediction is only as good as the system behind it. Manual spreadsheets, gut-based festive demand forecasting, or fragmented reports can’t keep pace with the dynamic shifts in consumer demand. That’s where MapleMonk’s Demand Planning Tool steps in to turn festive chaos into clarity.
So when next year’s festive season arrives, you’re not reacting to trends, you’re leading them.
Make this year’s festive data work harder for you. Try MapleMonk’s Demand Planning Tool and plan 2026 with foresight, not hindsight.