Revenue leakage is the quiet profit killer that shows up in board decks as “missed targets,” in marketing dashboards as “wasted ad spend,” and in finance reconciliations as “mysterious shortfalls. Revenue leakage doesn’t occur with a sudden loss of profit, it is lost slowly through many small losses every day such as unbilled contracts, mismatched attributions, bot clicks on ads, refunds that are not updating inventory records etc. If left uncorrected, these small losses will eventually accumulate into much larger losses that will have a significant impact on overall business profitability.
This long-form guide explains what revenue leakage actually is, the measurable causes of revenue leakage, the real business and financial impact , and critically an actionable playbook you can use to stop profit leakage across marketing, sales, eCommerce, and finance.
Revenue leakage is any situation where the business fails to capture, record, or recover revenue it is entitled to. It could be thought of in a similar manner to a plumbing issue which, while appearing to be in good working order until they are under water pressure, will demonstrate the issue with leaks appearing as a result of cracks in the plumbing system.
Some revenue leakage examples include unbilled services, incorrect attributions of advertising spend, lost sales orders and/or double refunds, as well as poor data causing teams to make bad decisions.
You might think revenue leakage is a minor “dust-in-the-corner” issue. But the reality is stark.
Companies regularly miss revenue targets. A survey found that 60% of companies didn’t hit their 2023 revenue targets, showing how often expected revenue slips away before closing the books.
Industry estimates suggest profit leakage can be material, for example, some revenue leakage analyses indicate companies may lose up to ~5% of earnings to leakage-related issues like billing leakage errors and underpricing.
About 42% of companies report having experienced revenue leakage.
In the digital advertising world in particular, the scope of lost spend is staggering. Global losses are projected to reach $41.4 billion in 2025, up from $37.7 billion in 2024, according to Spider Labs‘ latest ad fraud white paper report.
A report published by Juniper Research reveals 22% of all digital advertising spend in 2023 was attributed to fraud, which is a whopping $84 billion and this is not the worst news, this number, if a current trend will continue, is projected to reach $172 billion by 2028.
Projections indicate continued escalation. Some estimates foresee global ad-fraud losses rising to US$172 billion by 2028 unless preventive measures are scaled.
What does all of this mean for the average mid-sized business? Even a “mere” 2% leak in revenue for a company with $50 million in sales translates into an annualized loss of $1 million, invisibly. For large companies, the effect becomes exponentially more significant. And this is just what is evident, loss from unaccountably captured costs through misattribution/abandoned cart/invoicing, etc. typically go unnoticed.
In summary, revenue leakage is not merely a rounding error for numerous businesses, but instead, it is structurally undermining the business’s long-term profitability and growth that is occurring without recognition or awareness.
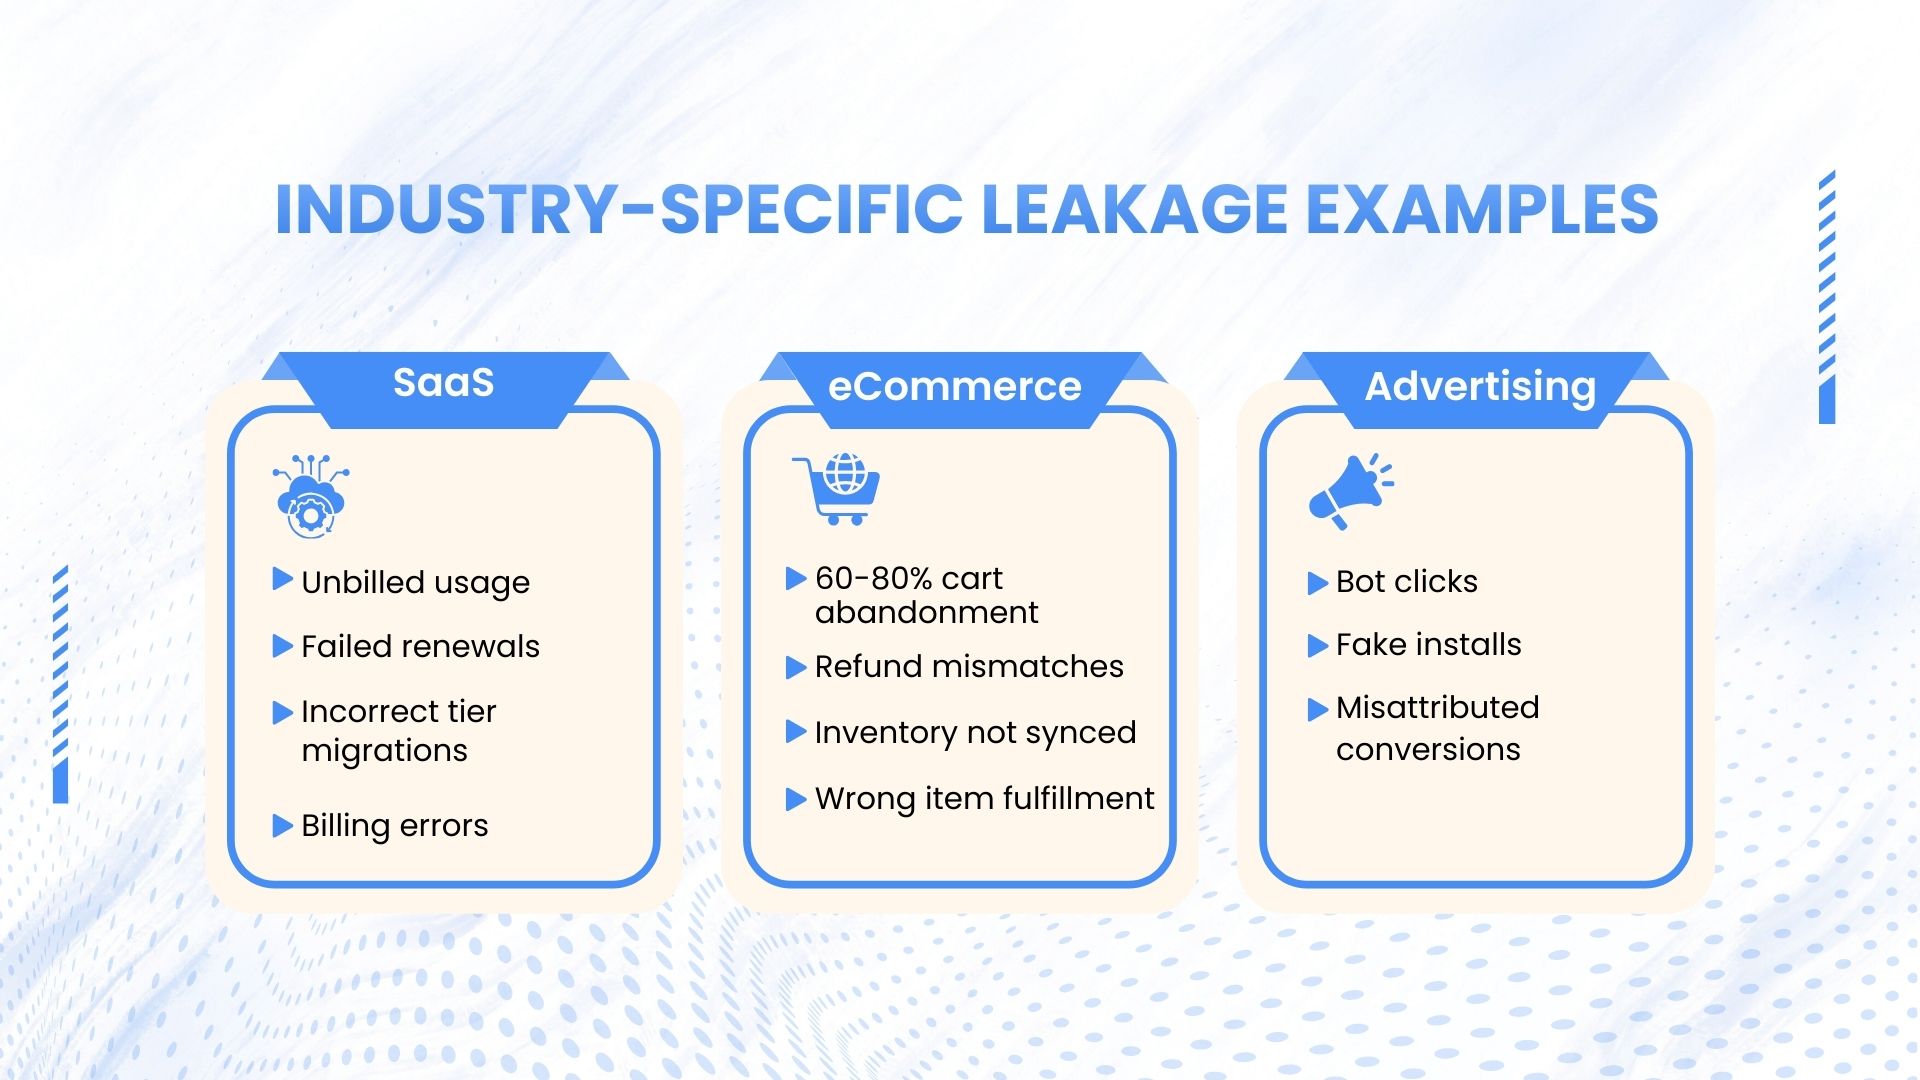
Below are some of the most common leak channels used in SaaS subscriptions, eCommerce and Digital Advertising, along with additional context, examples from the industry and early detection tips.
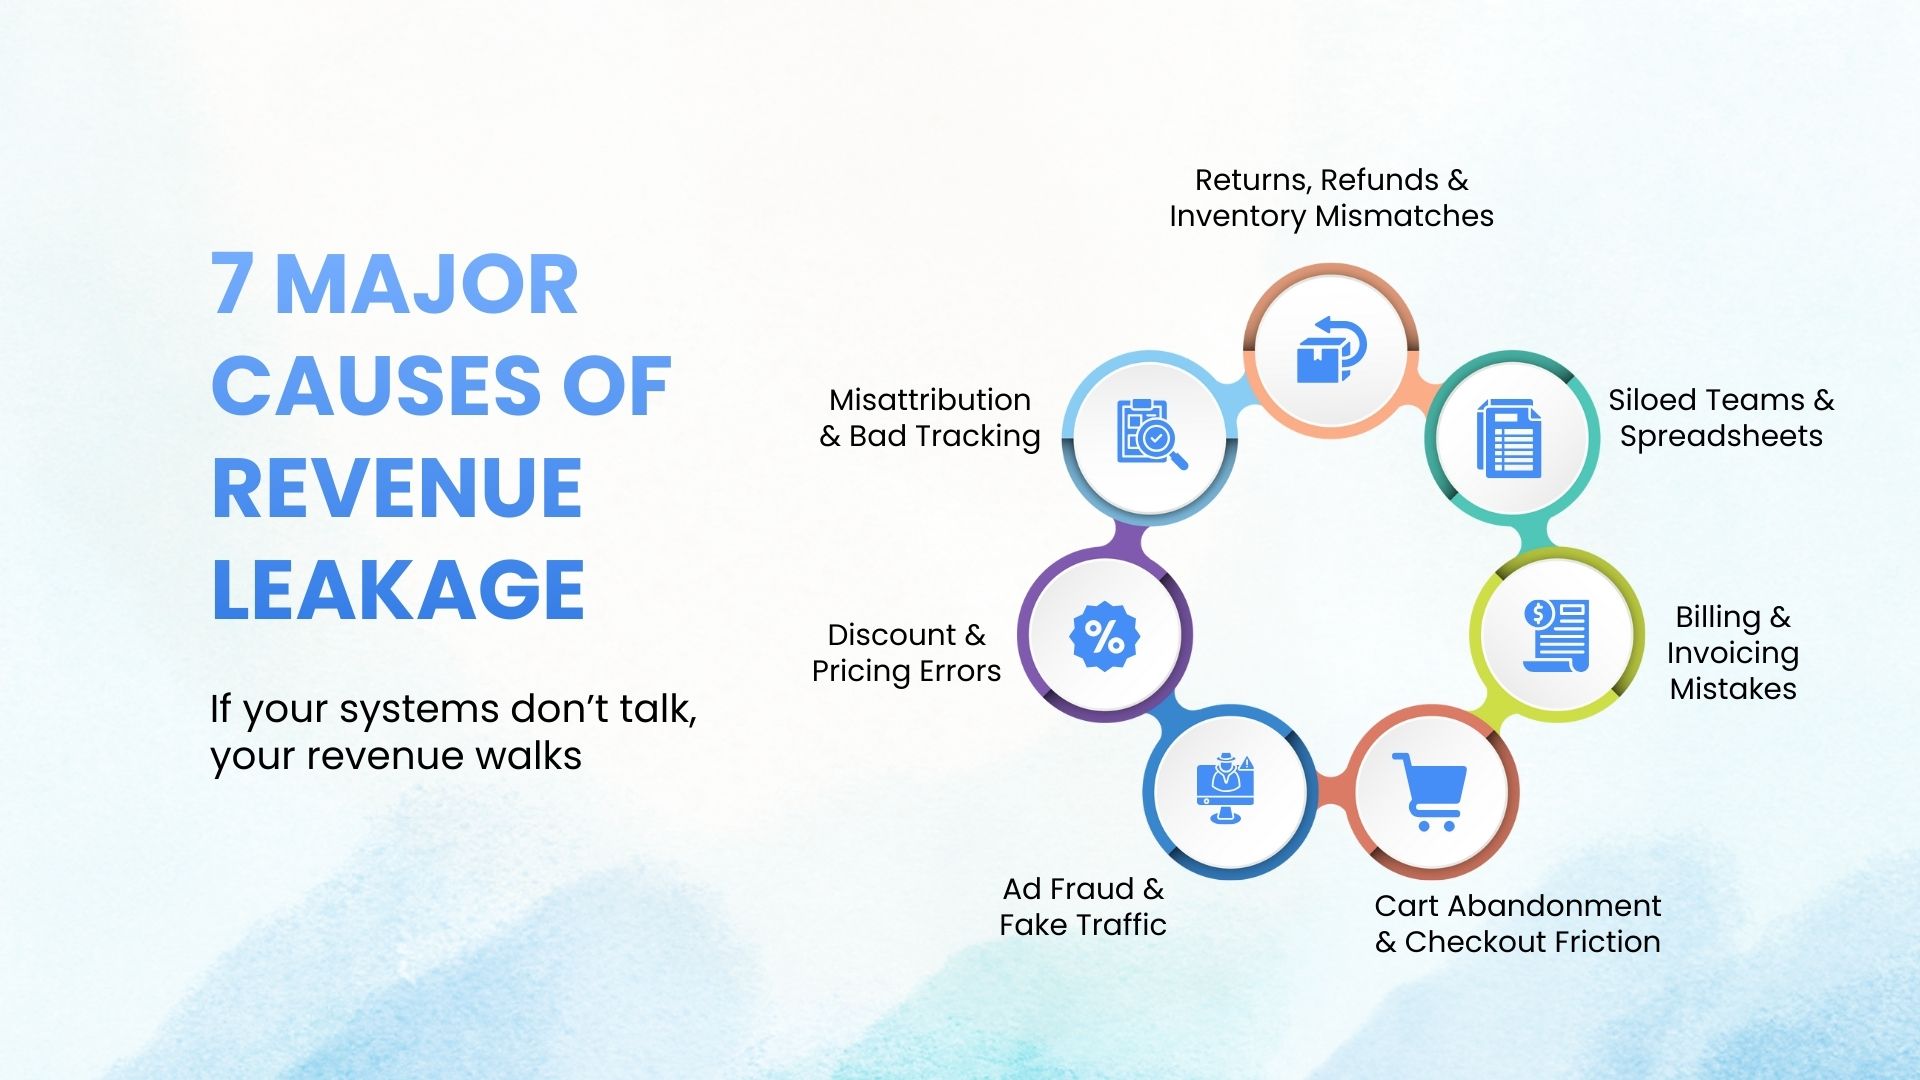
Why it leaks: When marketing channels and conversion events aren’t matched correctly with revenue, the budget allocated to a channel is not being spent effectively, and “dead” campaigns continue to run. Similarly, Misattributing a conversion event to a channel that doesn’t produce a return on investment can cause other channels to go unrecognized while remaining useful for scaling the business.
Signal: You will notice that the ROAS on the ad platform and the total revenue reported through your backend are not aligned, or that your CAC is continuing to increase without an increase in revenue.
Detect: Reconcile the ad platform’s reported conversion events with your server-side revenue on a weekly basis to perform a full-fledged revenue leakage analysis. Track and find discrepancies by channel.
Leakages due to inaccurate tracking and misattribution are a common occurrence within growth models that rely heavily on advertising; such as D2C brands, marketplaces, and subscription businesses. Ad platforms generally report conversion events based upon pixel and fingerprint tracking. However, when ad platforms report these conversions, many of them can ultimately be refunded, canceled, or ultimately not converted. As such, relying solely on the ad platform’s performance metrics may give an organization a false sense of confidence in a channel or channel mix.
Therefore, an attribution-to-revenue reconciliation is essential to detect this leak early and do the revenue leakage control.
Why it leaks: Bots, fake installs and click farms devour your budget, while offering no verifiable income for your business. While it may appear that you are achieving success in terms of key performance indicators like clicks, installs and conversions and there is no revenue from actual customers.
Signal: Large numbers of clicks and engagement volume from sources that do not produce significant downstream conversions or purchase rates; Clusters of odd geographical locations or IP addresses; Bizarrely, low session-to-order ratios; High bounce rates and/or extremely short session duration from paid traffic.
Detect: Identify ways of detecting fraud using signals (anomalies in IP addresses, order of events, etc.), Compare/reconcile paid clicks against converted orders, Create alerts for suspicious conversion activity.
This leak type “is a particularly insidious form of fraud,” not only is it reducing your return on investment (ROI) but also creating an inaccurate picture of your business’s performance, resulting in erroneous marketing strategies and possibly causing you to invest heavily in channels that are not producing measurable results for your business.
Why it leaks: A huge percentage of carts are abandoned for reasons like surprise fees, forced account creation, limited payment options, or slow checkout flows.Each cart that is abandoned equates to revenue that loses potential sales opportunities.
Signal: A high percentage of abandoned carts after reaching the payment page, a significant percentage of users entering the checkout process with no intention of completing, and high numbers of ‘add-to-cart’ activities without any subsequent purchase.
Detect: Calculate the total abandoned carts and determine the highest drop-off points in your sales funnel from your web traffic. Conduct revenue leakage analysis of your conversion funnel based on the source of web traffic and user-defined groups. Offer guest checkout, streamline payment and shipping options, and test UX improvements.
Most eCommerce businesses report that their cart abandonment rates are 60% to 80%. If you can increase your checkout conversion rate by only a few percentage points, you will recover a significant amount of revenue that will otherwise leak out of your business.
Why it leaks: Discount errors, unauthorized price overrides, or misapplied promotions can cause the revenue realized to be less than expected. If price changes are not tracked or audited, Finance may not reconcile actual versus list price appropriately.
Signal: Revenue realized not equal to expected revenue; frequent manual overrides in CRM/Orders; unexplained margin erosion on particular SKUs or customer segments.
Detect: Audit manual price changes; keep track of discount usage by rep as well as by sales channel; require approvals for discount overrides; reconcile expected versus actual revenue for every transaction.
This type of Revenue Leakage is particularly prevalent among businesses that have complex pricing structures (multiple levels), heavily discount (promote) their products, or sell custom deals very often. Businesses in B2B, Enterprise SaaS, Wholesale, and Marketplace industries are good examples of companies that experience this type of Revenue Leakage more often.
Why it leaks: Unbilled usage, duplicate invoices, or failure to apply taxes/fees can all cause revenue not to be collected. The SaaS/Subscription based services are especially susceptible to billing deficiencies that create revenue leakage.
Additionally, another common revenue leak is if payment methods of subscription expire or auto-renewals fail silently, revenue from ongoing subscriptions may drop without easy detection.
Signal: Large amounts of unapplied receivables; a large number of account write-offs; increased number of overdue invoices; a significant percentage of utilization is unbilled; frequent disputes relating to invoices issued.
Detect: Perform regular revenue leakage audits of accounts receivable status and accounts receivable collections; tracking billing vs. utilization; automating invoice creation; and performing weekly or monthly reconciling of utilization and invoices sent.
Studies performed on this issue indicate that companies, especially SaaS companies can lose 1% to 4% in annual revenue due to inefficiencies surrounding the billing and invoice creation processes.
Why it leaks: Fulfillment errors (sending the wrong item or shipping twice to one customer) or issuing refunds that aren’t matched to inventory and costing records tend to create losses.
Signal: A spike in refund rates for reasons not related to product quality or campaigns as well as inventory mismatches post return would signal this type of leak along with Cost of Goods Sold (COGS) that aren’t reconciled to any returned items and refunds that were issued without adjusting COGS and income revenue.
Detect: Tie return events to both refund and inventory flows; make sure refunds trigger adjustments in both revenue and COGS; reconcile returns data daily or weekly.
For D2C brands, marketplaces, or retailers who experience a high volume of returns, this type of leak can be significant; return issues are typically categorized as customer service issues and overlooked as financial events.
Why it leaks: When many different platforms (ad platform dashboards, CRM spreadsheets, and Marketplace Reports) are in use and there isn’t one single point of reference for your team’s data, it’s easy for “leaks” to go undetected. There is also a larger chance of error through the use of a spreadsheet-based process as opposed to other forms of storing critical data.
Because data is fragmented, there is no unified view of revenue, costs, refunds, usage, and discounts. That makes reconciliation hard and gap detection rare.
Research suggests a surprisingly high proportion of companies still rely on manual spreadsheets for core revenue workflows.
Signal: You can observe frequent month-end reconciliation backlogs, surprises once monthly or quarterly when reviewing financial books and reports, delays in closing out monthly fiscal periods, and a high level of exceptions found only at month-end.
Detect: Move the most critical revenue-based processes out of spreadsheets, centralize your data, use automated dashboards, and, finally, establish a cross-functional approach to revenue integrity ownership between marketing, finance operations, and product management teams.
This is the checklist you should run through this quarter.
Unify revenue events (orders, refunds, ad attributions, CRM closed-won) into a central data layer. Without a canonical data model, you’ll always reconcile “apples vs oranges.” Use server-side event capture and reconcile daily.
The use of a centralised data layer, as described above, will eliminate much of the uncertainty associated with the attribution of payment refunds/discounts and invoicing.
Stop relying upon platform-reported conversions. If you want to accurately assess how much your campaigns are converting (and to what extent) match clicks to conversions to revenue at the user/session level, whenever practical. The use of tagging and server-side matching will decrease the instances of misattribution and the impact of ad fraud.
Automate how invoices are generated and how companies collect usage data. Once invoices are generated, check for outlying invoices, and automate the flagging of any invoices that need to be disputed. For usage-based or subscription-based businesses, make regular revenue leakage audits of billing an ongoing priority for revenue leakage control.
Have dashboards that document every invoice compared with its corresponding contract and with actual usage/renewals, alerting you immediately upon the detection of a mismatch.
Tackle the biggest known drivers of abandonment: surprise fees, limited payment methods, and forced sign-ups. Test simplified checkouts, guest checkout, and alternate payment methods (e.g., local wallets, UPI, etc.) depending on region. Monitor impact.
Given high abandonment rates (often 60-80%), even incremental UX improvements can lead to meaningful revenue lift.
Tie the return event to both refund and inventory flows. Make sure finance sees the net impact on revenue and cost of goods sold (COGS), not just the refund number.
That helps avoid double-cost hideouts (inventory, refund and COGS mismatch) which silently eat margin.
Move away from manual spreadsheet reconciliation for daily critical paths. Replace with dashboards that reconcile in near real-time and flag exceptions for human review.
Manual spreadsheets are slow and error-prone; automated pipelines are faster and more accurate.
MapleMonk is built to stop the profit leaks listed above by acting as the revenue intelligence layer that sits between your data sources and your decisions. It unifies ads, sales, CRM, marketplaces, and retail into a single, real-time intelligence layer so you can see where money is leaking and why, not just that a gap exists.
Specifically, MapleMonk helps by:
These capabilities translate into both recovered margin and better strategic decisions: fewer wasted ad dollars, fewer billing disputes, and a cleaner path from acquisition to revenue.
In today’s data-fragmented environment, revenue leakage is not an anomaly, it’s an inevitable outcome of siloed systems and delayed reconciliation. The longer these gaps go undetected, the more they distort your performance metrics, inflate acquisition costs, and slow down growth.
The brands that will win over the next decade are the ones that treat revenue integrity as a core operational discipline, not a quarterly clean-up task. That requires systems that don’t just collect data, but connect it, reconcile it, and surface the truth behind every dollar earned or lost.
This is exactly what MapleMonk enables as a data analytic tool. By unifying revenue signals across Marketing, Sales, Marketplace, Finance, and Operations and by detecting mismatches the moment they appear, MapleMonk eliminates the blind spots where profit leakage hides. So, this is your chance to reduce revenue leakage.
If you want to protect every dollar you earn, reclaim wasted spend, and give your team a single source of financial truth, the next step is simple. Bring all your revenue intelligence under one roof. Let MapleMonk show you where the leaks are, and how much you can recover.