Data analytics in 2026 has evolved from simply providing dashboards and reporting capabilities to offering comprehensive insights into virtually every aspect of a business. In fact, in 2026 most businesses already have access to extensive data on their sales, marketing efforts, operational metrics, customer behaviour and financial results. However even with the availability of this wealth of information business executives are still struggling to be able to quickly identify issues that arise and be able to take action in order to preserve profit.

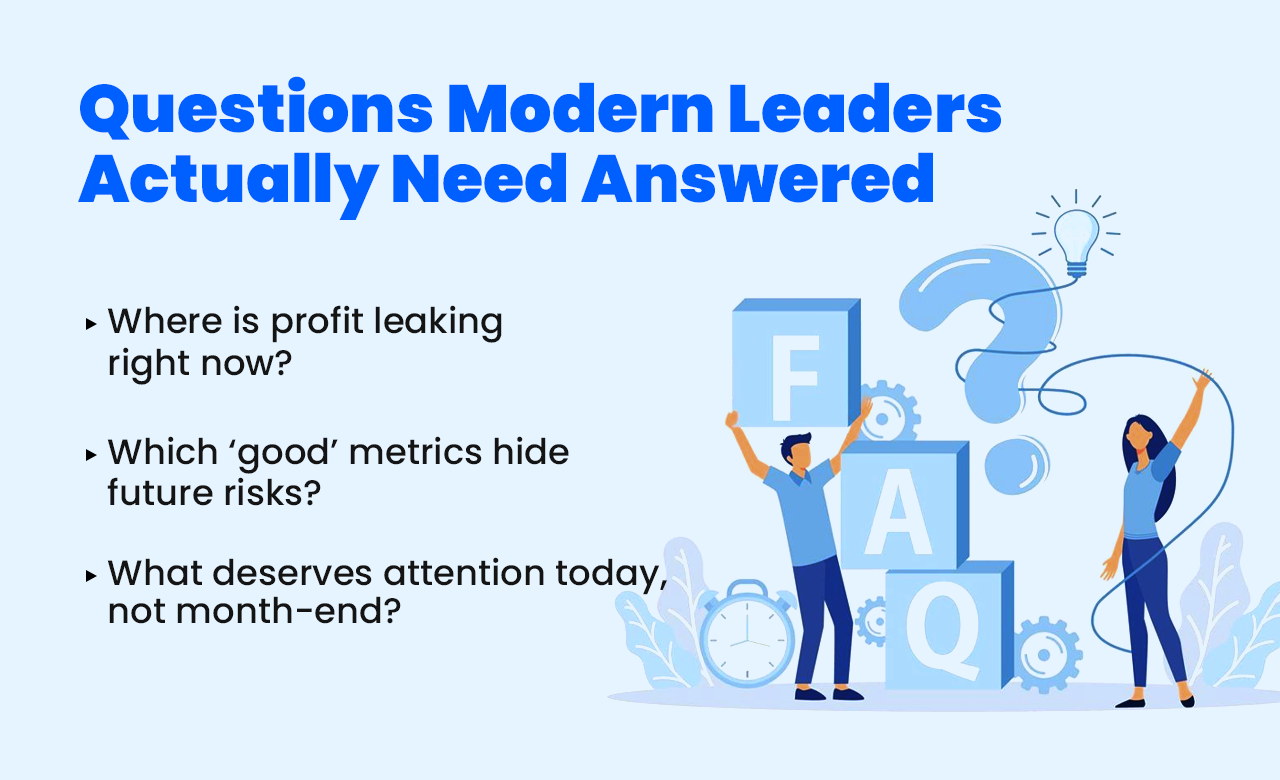
The traditional approach to analysing data is to use big data tools that enable us to analyze past performance. However, business in 2026 requires answers to a number of much more in-depth questions.
Because of the above, the choice of the appropriate advanced data analytics software platform is no longer just a technical consideration but rather a strategic decision.
The following are the top 5 data software tools available in 2026 with the first no code data analytics platform listed being the one that has been developed specifically to address the issue of the new age.
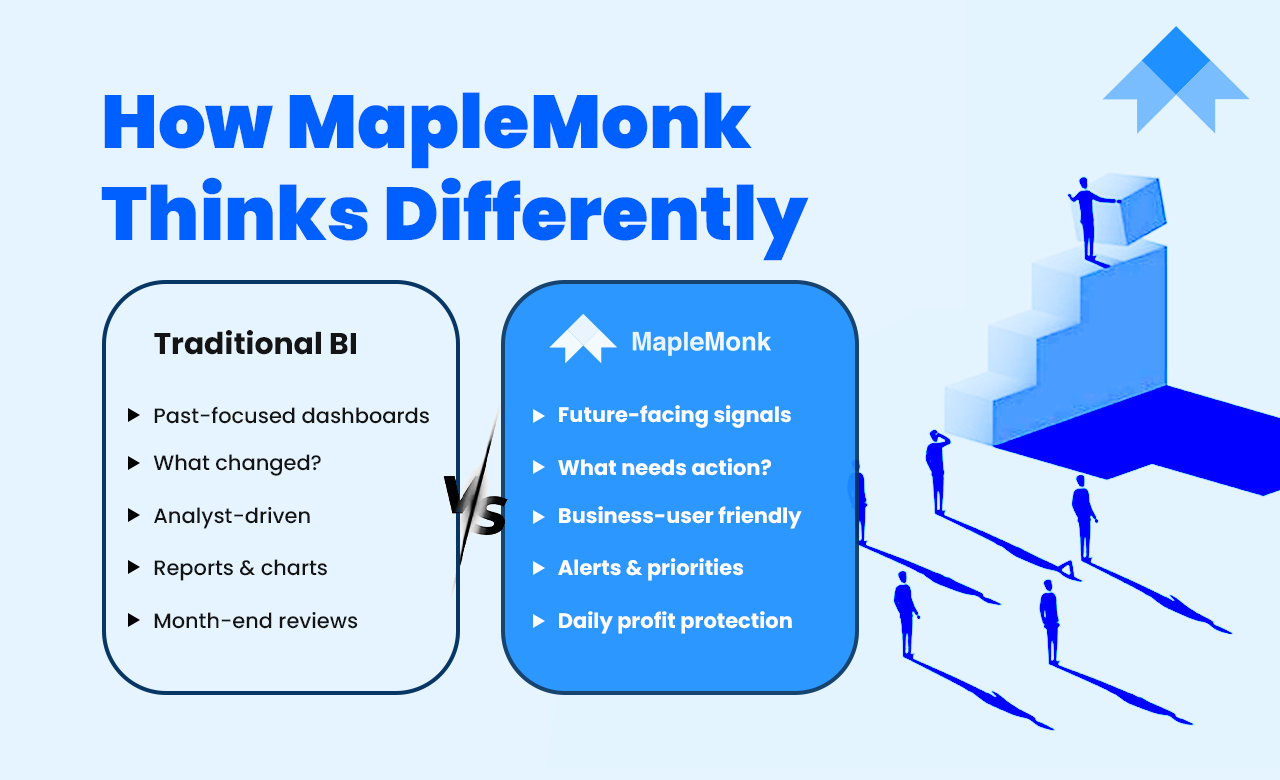
Most data analytic platforms only provide historical information. For this reason, the emphasis of MapleMonk is not on how well a company has done in the past but rather on how many opportunities a company has for making a profit before the actual loss takes place.
While conventional advanced data analytics tools rely on continuous dashboards that display data trends, MapleMonk provides big data tools that focus on detecting and responding to market signals to help you make informed decisions through ongoing data analysis to enhance company margins and gain competitive advantage.
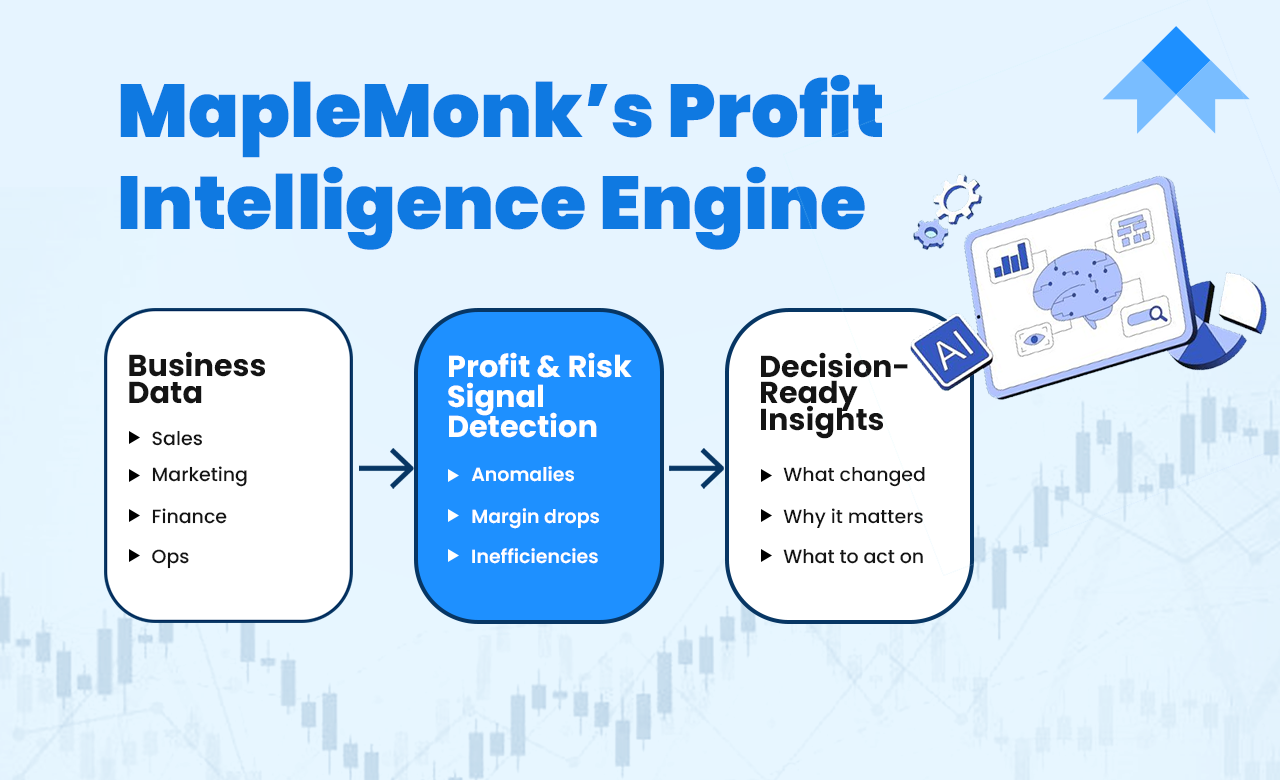
By converting complex data sets into insightful decision-ready formats, MapleMonk provides business executives with an easy-to-use no code data analytics platform for easily evaluating and also making business decisions based on data collected from both internal and external sources. As a result, MapleMonk also bridges the gap between raw data and corporate actions.
Key Features of MapleMonk:
Best for: Businesses that want to protect profit and act early, not just monitor numbers.
Microsoft Power BI has become a global and modern data analytics software of choice for many businesses because of its deep integration with Microsoft products. Companies that already use Excel, Azure, or Microsoft 365 can easily add on Power BI for centralized reporting and performance monitoring.
Power BI does an excellent job of creating interactive dashboards that combine multiple data sources. Teams can monitor KPIs in real-time as well as easily distribute reports between departments. While Power BI makes it straightforward to view current performance of business metrics, it leaves the user to determine and understand the reasons behind performance.
For companies that have a well-defined reporting and analytical process in place, Power BI continues to be a solid option for presentation of metrics and performance information.
Key Features of Power BI:
Best for: Organizations that need consistent, scalable reporting across teams.
Tableau excels at offering users comprehensive data analytics tools for data visualization as well as the means to create impactful narrative visualizations of extensive datasets for easy presentation and engagement by end users. In addition, Tableau allows end users to become engaged with their datasets through exploratory analysis, which enables them to identify patterns within their datasets and effectively communicate any insights they derive back to stakeholders.
Analysts utilize Tableau most frequently in an exploratory manner because it gives them the ability to look at their data from different perspectives by drilling down into specific pieces of their data. However, Tableau is dependent on each user being able to interpret and explore the dataset properly, and therefore, Tableau does not automatically give higher priority to the insights or potential risk associated with a given data point or set of data points.
Tableau is a superior visualization-first solution for organizations that have developed their ability to provide high-quality analytical support.
Key Features of Tableau:
Best for: Data analysts and teams focused on visual exploration and storytelling.
Looker from Google is for organizations that mainly do business in the cloud. Instead of moving your data into the Looker environment; Looker connects directly to your cloud warehouse, using a modeling layer to provide the business rules and definitions of your metrics.
By having a common definition and business logic for your metrics, Looker eliminates the confusion and lack of alignment from having multiple teams within an organization developing their own views of the same metrics. However, Looker can require technical resources to implement and support, which makes it less accessible to non-technical employees.
For those organizations with data teams and a cloud-first strategy, Looker provides good governance and scalability.
Key Features of Google Looker:
Best for: Cloud-first organizations with strong data engineering support.
The Associative Analytics Engine (AAE) of Qlik Sense enables persons to engage with and study associations across data without the constraints present in classic databases. Their ability to discover connections that conventional BI systems might overlook will likely lead to new insight.
The platform is powerful for exploratory analysis, but it can feel complex for users who are new to modern data analytics. Turning discoveries into actionable decisions still requires analytical expertise.
Qlik Sense works best in environments where teams are encouraged to explore data deeply and experiment with different analytical paths.
Key Features of Qlik Sense:
Best for: Teams that prioritize exploratory data analysis and data discovery.
The focus of data analytics software in 2026 will not be on what types of dashboards a company can use. Instead, it will be on the effect that decisions created through the use of these big data tools have on a company’s bottom line. Most of the data analytics software listed above perform well for various forms of reporting, visualization, and detailed advanced analytics, but the true benefit of a data analytics program is how quickly a team can take action based on the insights gained through the data analytics program.
As businesses grow and experience greater and greater margin compression, having visibility into profit drivers and risks associated with growth will be critical to their continued success. The most current data analytics program available now is MapleMonk which is a data analytics tool with a different slant from traditional reporting tools in that it places an emphasis on the identification of profit and risk signals at an early stage.
The most effective data analytics tool is the one that provides the fastest pathway from data to decision. For teams whose goal is to preserve profits while continuing to expand, MapleMonk naturally fits the bill.